

Table of Contents:
- What is crypto trading
- Traits needed to be a good crypto trader
- Hardware and software needed to day trade crypto
- Charting basics in Tradingview
- Common day trading chart patterns
- Trading indicators (day trading or swing)
- How to build your day or swing trading strategy
- Type of orders
- Paper Trading cryptocurrencies (Demo Trading)
- Trading Crypto on Binance (Live Trade)
- Trade Crypto on a trading platform
- Trading ressources
- Hope you enjoyed it!
- Trading Tools
- Become a better trader!
- Up your Trading Game!
In this guide, I will show you how to trade crypto.
You will be able to start day trading, swing trading or any other type of trading for cryptocurrencies.
When you are done reading the guide, you will be able to go on a crypto exchange and place your orders, draw technical analysis, use trading indicators, create your own crypto day trading strategy, and way more!
This guide is pretty big and you might not go through it in only one session.
If you are really dedicated to becoming a crypto trader, I highly suggest that you bookmark this page for future reference.
Even if you do it all in one shot, just save it in case you in a little refreshment.
Ready? Get comfortable and enjoy!
What is crypto trading
Crypto trading is the act of buying a coin or token with the purpose of selling it at a higher price. The ultimate goal is to generate profit.
A crypto trader will know when to buy when to sell and most importantly, how much he should buy. He has a plan that covers every aspect of the trade.
Please note, I am using the words Buy and Sell which are referring to a SPOT market trader (you own the coin you buy). But traders usually trade Futures market (contracts) which allows you to SHORT a coin and generate a profit of its fall.
In this guide, I will mostly refer to SPOT trading as it is easier to understand.
Types & Style of crypto trading strategy
There are multiple ways to trade the crypto market.
Before you get started and trade with your hard-earned money, you should know which strategy type is best suited for you. You need to be comfortable with it.
You will need to find what is the best type and style of strategy for you.
Strategy Type
The strategy type refers to the duration of your trades.
Do you want to do multiple trades every week or do you prefer to just do a few a month?
Whatever you choose, be realistic and make sure you have the time to execute it.
I would suggest any beginner go for swing trading or position trading. These trading styles are slower, the charts trends are usually more defined and you will be less affected by the crypto market volatility.
Here’s the different type of trading (duration):
| Trading Type | Timeframe | Duration | Chart used |
|---|---|---|---|
| High-Frequency | Short-Term | Milliseconds | >1 sec |
| Scalping | Short-Term | Seconds to few Minutes | 1-5 Min |
| Day Trading | Short-Term | Minutes to few Hours – No Overnight | 15 Min |
| Swing Trading | Short/Medium Term | Few Days to Months | 1-4 Hours |
| Position Trading | Long-Term | Weeks to Years | 1D-1 Week |
For example, if you have a day job and 2 kids, having a day trading strategy or scalping is probably not a good idea as it will be almost impossible for you to execute it. A swing trading strategy would probably be more appropriate.
Knowing this will avoid you a lot of frustration as a beginning trader will usually go left and right trying to find what will work for them. Focusing on a trading type that matches your lifestyle will greatly increase your chance of success.
Crypto Trading Style
There are 2 main trading styles when it comes to building a strategy. Trend Following and Mean Reversion.
Trend followers will enter trades in the direction of the trend. For example, if the market breaks a new all-time-high or 3 months high.
The Mean Reversion style assumes that Coin and Token will most likely return to their average price. Traders using this style will buy when the market is trading lower than the average price and Sell if the price returns to that average.
Don’t worry, we will see how to find the average price later.
As you can see, these 2 styles are completely opposite. One buy on strength and the other buy on weakness.
Trend followers will have many small losses as when the price goes against them, it means that there is no more trend so no reason to be in the trade. But they will also have big winners. Because as long as the price is going up, there is no reason to exit the trade which can lead to huge profit.
Mean Reversion works most of the time. They will close their trades fast as they return to the average price. From time to time, they will have very big losses. This is due to the fact that the further away from the average the coin is, the better it is to buy it. Meaning that if a coin keeps dropping, the trader might get stuck waiting for it to come back to the average.
Traits needed to be a good crypto trader
I hope you will recognize yourself here. Because those are important traits that you will need if you want to become a successful crypto trader.
You can always have success if you don’t have all these Traits, but the road might be a little rougher.
- Discipline
Once you will have your strategy set up. It will be very important to stick to it. Sound easier than it is. STAY DISCIPLINED! - Patience
You will have to fight the urge to trade, if your strategy doesn’t tell you to buy, then DON’T! Same for selling, even if you have great profit, if your strategy didn’t tell you to sell, be patient and wait. - Independance
You have to remember all the time, you are a trader now. You have a strategy to follow. What other say on Facebook, Reddit or Twitter is not part of it. Stick to your plan! - Persistence
You will be tested non stop in the crypto market. You will lose many trades, sometime way too many trade in row. It will be hard. Focus on your process! - Optimistic
See the good side even when it goes wrong. Learn from your mistake, you need to know that if you keep going, you will get somewhere!
I listed 5 important traits that will help you. There are more, but if you got those, it’s a great start!
If you don’t have these traits, try to keep them in mind when you are trading and control your emotion. It might be hard but this is important!
Hardware and software needed to day trade crypto
You really don’t need much to start crypto trading. Some go crazy and want 3-4 screens, but you are perfectly fine with a laptop.
In the beginning, you should be more focused on learning than looking like a wall street hotshot.
Here’s the basic minimum needed:
- Laptop or PC
Anything that can go on the internet will do. This is just to visualize charts and put your order on the exchange.
Don’t go spend 1000$ on a new PC or laptop, if you already have one now. Keep your funds for trading! - Internet Connection
At least a cable internet connection. Chart can have lots of real time data and a slow internet connection might be frustrating. - Tradingview account (free)
Tradingview is where you will vizualize the charts and do your market analysis. We will get into the details of Trading view very soon. (don’t search for it yet, stay focused 😉 ) - Crypto Exchange account
This is where you will buy and sell coin/token. In this guide, I will use Binance as exemple as it is the biggest crypto exchange in the world. Again, we will get there soon, stay with me..
Create a Tradingview account
This is pretty simple, go to the Tradingview website and create an account. (This is an affiliate link, if you go for the paid version, you will have 30$ off.)
Now you can go to the chart section to get a glimpse of your future.

Once in the chart section, click on the symbol name in the top left corner.
You can then enter any coin, for example, BTC in the search bar.
From there you will have multiple choices. You can filter by clicking the All Sources button and only selecting the exchange you plan to trade on.

You should now have the price chart of the crypto you selected.

That’s it for now with Tradingview, don’t worry we’ll get back to it very soon and I will show you the cool stuff!
Create a Binance account
Now you will need a Binance (or other exchange of your choice) account in order to trade.
You will see that all the crypto exchanges have charts like Tradingview, but we use Tradingview and not the exchange to do our analysis.
This is because the exchange won’t provide you with all the tools needed, like indicators. Also, exchanges won’t save what you draw on the chart. So to make sure to not lose your work, always use Tradingview.
Ok, back to Binance, go to www.Binance.com, and create an account. This is also a referral link. By using it, you will get 10% off on the trading fees. This can be huge over time and depending on how much you trade.
That’s it for Binance at the moment. You can explore it a bit but we will get back to it later. Time to learn how to trade first.
Charting basics in Tradingview
We can now go back to Tradingview so I can show you how charts work. Go here: https://www.tradingview.com/chart/ABBkRIp7/
It can be a bit intimidating at the beginning, but it is easier than it might seem.
In that section, I will explain to you everything you need to know to understand how a crypto chart is generated and how you can use it to determine your next trade.

What are candlestick charts?

There are many types of charts available to you on Tradingview like Bars, Line, Heikin Ashi, but today we will focus on the most common chart, the Candlestick chart.
In a candlestick chart, there are 2 Axis. The Horizontal Axis (X) represents the time and the Vertical Axis (Y) represents the price.
The candles are the Red and Green vertical rectangles that you see on the chart.

Each candle is built of 4 different components:
- Open (O)
- High (H)
- Low (L)
- Close (C)
When a candle is green, it means that the open is the bottom of the body (Filled up part of the candle). If red, it means that the Open is the top of the body.
This is due to the fact that a green candle represents a candle that closed higher than it opened and vice versa for a red candle.

If you hover a candle with your mouse and look at the top of the chart, you will see the OHLC of that candle. The last number is the difference between the candle that you are hovering and the previous candle.

Charts interval
The chart interval goes hand in hand with the candles. Each candle represents 1 interval.
Meaning that if you select a 1D chart, each candle tells you the OHLC of 1 Day. If you select a 5min interval, each candle is equal to 5 minutes of price action.
You can change the chart interval from the top menu of the chart.

Support and Resistance
Most crypto traders use Support and Resistance when looking for their next opportunity. Support and Resistance are price levels where the market has a tendency to reverse.
What are Support and Resistance
The Support is a zone where a falling price bounced many times in the past.
The Resistance is a zone where a climbing price got reversed many times.
The bigger the time interval the stronger the support and resistance will be. Support on a 5min chart is way weaker than support on 1h and can’t even be compared to a 1D or 1 Week support.
Here’s an example of Support and Resistance for Bitcoin on a 1 Week chart. Those areas of S/R are very strong as they are created on a 1 Week chart. Each candle represents 1 Week of price action.
You can see how the price is being supported at the bottom and the strong resistance of the 58352-64854$ zone.

Once broken, support will often become resistance, and resistance will become support.
Below is an example of how Support and Resistance act once they are broken. The image shows the same Resistance as the previous example, but zoomed in by using a 4H chart (each candle = 4 Hours)

How to draw Support and Resistance
The easiest way to draw your Support and Resistance is the start on a 1 Week chart from the left side of the chart and draw a Horizontal Ray at the top and bottom of each major moves. (I will show you how to draw Horizontal Ray very soon)
As you move toward the right side of the chart, you will see that fewer and fewer Rays need to be made as the Support and Resistance are being respected over time.
It is not always 100% accurate and will usually be a Zone and not an exact price. But by adding it to your chart, you can stay cautious and avoid buying near a resistance.
Once you did the 1 Week chart, you can proceed to do the same exercise on the 1D chart (use a different color of Ray). Then do it on the 4H and all the way to the time interval that you wish to trade on. Use a different color for each time interval.
Remember that the 1 Week is the strongest S/R and the priority will go down each time interval lower.
A good time to Buy would be once the resistance is broken and preferably tested and prove that it is now acting as a support.
Here’s an example chart of BTC Support and Resistance on a 1 Week chart (each candle represent 1 week)

To draw a Horizontal Ray on Tradingview, you will need to click on the 2nd option of the left side menu and Select Horizontal Ray as shown in the image below.

To make the Ray more accurate and easier to place on the chart, Activate the magnet tool lower in the left sidebar.
The magnet tool will place the ray to the lowest or highest point of the candle that you are hovering.

Trend lines
Trend lines are similar to Support and Resistance.
In an uptrend, we will draw a trend line connecting 2 or more lows and in a downtrend, we will connect 2 or more tops.
The trend line will act as a support in an uptrend and a resistance in a downtrend

Once a Trend line is broken (candles start to close above or under it) it is a good time to exit your position and wait to see what the market will do next,
It is always best to trade in the direction of the trend.
To draw a Trend line on Tradingview, select the Ray option in the left side menu.

For an uptrend, connect the lowest point of the start of the trend to the lowest low of the first price drop.
For a downtrend, do the opposite. Connect the highest point at the start of the trend to the first peak top that follows.
An important thing here, to be considered a trend line, you will need to have at least one confirmation. Meaning that you need to have that trend line re-tested and then have the price reverse back in the direction of the main trend.
Take a look at that video as it might help you understand how to draw a trend line. I selected this video as I like how he explains it and also that he is not so strict about how it should actually be done, which is the way I prefer.
Logarithmic vs Linear charts
Once you start drawing trendlines, I would strongly suggest that you switch your chart to Logarithmic instead of Linear.
A logarithmic chart takes into consideration the percentage of price change over time.
The regular linear chart gives you the same value interval on the vertical axis of the chart.
| Linear Chart | Logarithmic Chart |
|---|---|
 Interval of 500$ |  Change between each ar all equal in % |
Now you might wonder why a logarithmic chart matter. It does due to the high volatility of the cryptocurrency markets.
Coin and token values increase and decrease a lot over time. Bitcoin going up from 10k to 13k is equal to a 30% increase. But from 50k to 53k, it is only 6%.
Using a linear chart will give you the impression that the move from 10-13k has the same impact as the 50-53k. This is not the case, the move from 10-13k is way more massive. That will be shown accurately on a logarithmic chart.
When it comes to big trends, meaning trends that you will chart using 1D candles or more, you should always use the logarithmic chart. As those trends have the biggest price change from the beginning to the end.
Look at the difference between those 2 same trendlines:
| Linear Chart | Logarithmic Chart |
|---|---|
 |  |
Now in order to change your chart setting from linear to Logarithmic, click on the LOG option at the bottom right of your chart.
Once blue, it means that your chart is now using the Logarithmic Scale.

Common day trading chart patterns
There is no one-size-fits-all when it comes to crypto trading. What I do might not be what you are comfortable with.
So even though I am not personally trading chart patterns, I think it might be useful to you to get acquainted with some of the most popular patterns in crypto trading.
Chart patterns are a series of candles that tend to repeat. The outcome of these patterns can give you good entry points.
Head and Shoulders pattern
Probably the most popular chart pattern out there is the head and Shoulder pattern.
It is a trend reversal pattern displaying the transition from bullish (uptrend) to bearish (downtrend).

The head and shoulder pattern is built with 3 peaks and 2 valleys. The middle peak is higher than the 2 side ones.
The 2 valleys form the neckline. Once the neckline is broken, the head and shoulder pattern is confirmed. This is when a short position or a switch to stay in a stable coin is recommended.
The neckline doesn’t have to be horizontal.
The drop after the neckline is broken is usually about the same size as the neckline to head height. You should use the logarithmic chart and use percentages to find that height and drop size to keep all proportions equal as the price changes.
Reverse head and shoulders
The reverse head and shoulder are exactly the opposite. It announces a switch from a downtrend to an uptrend. The head is the lowest point in the middle of the 2 shoulders. the neckline is above the head and once broken the price should go up for about the same distance of the height between the neckline and the head.
Double top pattern
The double top pattern is similar to the head and shoulder but without the head.
It is a bearish pattern and it is confirmed once the neckline is broken. Once broken, the price should drop about the same percentage amount of the neckline to the height.
The 2 top can be slightly different in height.
The double top is showing you a rejection by the market to create a new high. The break of the neckline (support) confirms that the trend is now changing.

Double Bottom
The double bottom pattern is the opposite of the double top.
It indicates a trend reversal to the upside (bullish) once the neckline (resistance) is broken.
You can recognize it by its W shape in a downtrend.
Once the resistance is broken, a long position (buy) can be done. You can also wait for the re-testing of the resistance which should now act as a support.
More chart patterns
There are many more chart patterns out there. I only listed the most commonly used to give you an idea of how this could help your trading.
Chart patterns are only one way to trade crypto, if you feel that it is a good way for you, you can check out these resources:
I think that with these two in-depth guides about chart patterns, you will have a good basis on how you can apply it to trade BTC or other cryptos successfully.
Trading indicators (day trading or swing)
Trading indicators are tools that help you spot trading opportunities in the crypto market.
This is what I use to build my trading strategies. They are easy to add to any crypto chart.
You can use trading indicators on any timeframe.

Adding an indicator to your chart
To add an indicator to your crypto chart, follow these steps:
- Click on the indicators tab at the top of your tradingview chart.
- Enter the name of the indicator or go to Built-ins to explore.
- Click on the indicator that you would like to add to your chart.

The setting of your indicator
You can play with the settings of most indicators.
This can be useful depending on which timeframe you are working. It can also be good when you want to compare the most recent value of an indicator versus its long-term value.
To change the settings, hover the indicator name at the top left of your chart and click the options icon.

A new window will then pop up with the different settings available for that indicator.

Moving Averages
A moving average calculates the average price of a coin or token over a selected period of time.
You might have heard of the golden cross, which is a combination of two moving averages. In the golden cross, the 50 Days MA (moving average) is combined with the 200 Days MA. Once the 50D MA crosses the 200D MA on the upside, we have a golden cross. It indicates that the market is turning bullish (uptrend).
There is also the Death Cross, which is exactly the opposite, meaning when the 50D MA crosses under the 200D MA. Indicating a market that is turning bearish (downtrend).
Moving Averages are lagging indicators like most indicators that exist. I am not a fan of the golden cross and death cross for that reason.
Cryptocurrencies prices are moving very quickly compared to the traditional markets. Using a 200D MA on a crypto chart can work, but it is very slow to move compared to the prices.
I personally like shorter-length MA when I do my trading.
Below is the BTC chart with the 50D and 200D moving average.

There are many types of Moving Averages. In this guide, I will cover the 2 most commonly used MA.
Simple Moving Average (SMA)
The Simple Moving Average also called Moving Average is the most used of all the Moving Average types.
It calculates the average price over X periods. So an SMA(14) on a daily chart is equal to the sum of all closing prices of the last 14 days divided by 14. Which gives you the current average price.
It will look like this on a chart:

You can use the SMA to determine the direction of the current trend and only buy if the price is higher than the SMA.
You can also use it as a Buy signal and buy a coin if its price cross-over the SMA. Some crypto traders also use it as a trailing-stop-loss.
The SMA is a very useful tool to have in your trading toolbox.
Exponential Moving Average (EMA)
The Exponential Moving Average (EMA) is another type of moving average that is very popular amongst crypto traders.
It is very similar to the Simple Moving Average (SMA) but it gives more power to the most recent price movement. On a chart, the EMA will react faster to price volatility than the SMA
I like using the EMA instead of the SMA when I trade crypto as it is a very volatile market and I like my indicator to react quickly.
This is not for everyone, as I mentioned earlier, you need to find what you are comfortable with.
Using EMA might have the advantage of faster entry and exit signals, but it is also a double edge sword as you might get whipsaw a little more than with the SMA. (Whipsaw means that you get many losing trades in a row as the price goes up and down around your moving average.)
Below is a chart using an SMA combined with an EMA. You can see the difference in reaction time even if both are on the same length. In this chart, I’ve put the EMA in green and the SMA in blue. You can change the color and thickness of the Moving Average lines by clicking the options button as I showed you earlier.

Average True Range (ATR)
The ATR or Average True Range is a volatility indicator. It calculates the price range of X periods.
The ATR shows the average range of the last X candles in the form of a line similar to the Moving Average one.

In the image above, we can see the ATR was very low (around 2000$) and grew higher (3600$) in the most recent time.
This means that lately, BTC has been almost twice as volatile as in the past where each candle from the last 14 had an average movement in price of about 3500$
The ATR can be used in multiple ways to help you be a better crypto trader. Here are a few ideas on how to use it, but trading is all about finding your own way. Knowing that this tool exists can open many possibilities.
- Simply for volatility
Using the ATR for its basic function is perfectly fine. If you day trade or scalp, you might want to change your approach based on how volatile is the current crypto market. - Use it as a stoploss
You can use the ATR as a stoploss, multiply the current ATR value by 2 or 3 and deduce or add it to the current market price (depending which side you are trading). If the price hit that value, it mean that the market is going in the wrong direction as it reverse strongly against your position. - Trailing Stoploss
Similarly to the stoploss idea, after each candle close, reduce or add 2-3 ATR value. As the price climb or fall in the direction of your trade, continue to do this excercise and only keep the value that is closest to the current market price. Once the market reverse and hit your trailing ATR, exit your position. - Use it as a buy signal
You can create rules that if the price fall or rise by 3 ATR value during 1 or 2 candles, you open a trade. A price rising or falling quickly will usually keep pushing in that direction, especially if it breaks a support or resistance.
But you could also use it to trade a reversion type strategy where if it climb 3 ATR, you sell.
Donchian Channels
The Donchian Channels are built up from 3 lines.
The upper line indicates the highest high of X candles.
The lower line indicates the lowest low of X candles.
The middle line is the average of the Upper and Lower lines.

The Donchian Channels indicator is one of my favorite ones. You can use it to trade many different styles.
You can trade breakouts (price break above or below Upper or Lower line), mean reversion (price return to the middle line), trade higher high and higher lows, or vice versa.
Here are some examples:
| Mean Reversion |  | When the price touches the top or bottom lines and shows signs of reversion. You can enter a position on the side of that reversion and take your profit when the price reaches the median line or close on the opposite side. A stop loss can be placed at the line the price is reversing from. |
| HH/HL | 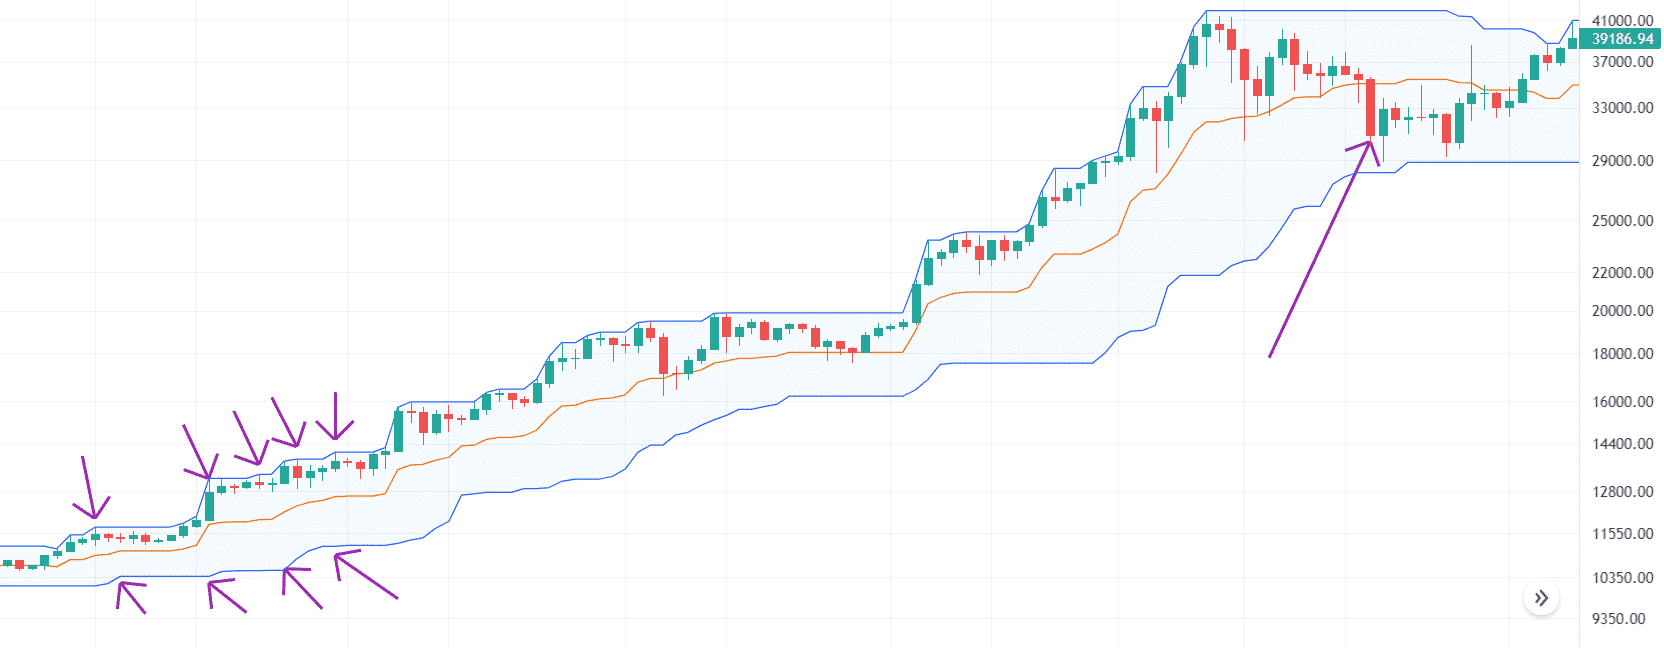 | When the upper and lower line starts creating new highs. A long (buy) position can be done. You can exit the trade once the price closes below the median. You can place your stop loss at the lower line. |
How to build your day or swing trading strategy
Now that you have some basic knowledge on how to use technical analysis and indicators to trade crypto, you might want to start doing some trade.
But knowing all this will give you nothing if you don’t know how to build a trading strategy for crypto.
Many people come with great ideas and good timing but they are missing some piece of the puzzle to start making money trading.
There are 3 major factors to take into consideration when you are building a crypto trading strategy. When to get in, when to get out and how much you should bet on your trades.
You need to be as systematic as you can be when you execute your trading strategy. Always do the same process and stick to it.
You should also test your strategy by trying it on paper trading first (Demo account, we will get to it soon).
Once you are confident in your strategy, you can start trading it with real money. Start with a small amount, paper trading and real money don’t have the same effect on your mind. Increase gradually as you gain confidence.
When to enter a position
First, you need to know when you get in a trade, Long or Short, you need to have exact rules for this.
Will you buy when the price hits support? Or will you wait for the support to break and enter a short position?
Will you only trade when a head and shoulders is confirmed?
This is all up to you and you will need to test it out. Play with different indicators, timeframes, patterns. the best way to learn is to really get into it.
When to exit a position
Once you know your entry trigger, you need to know when you will exit the position. This is as important as knowing when you enter.
You don’t want to be stuck in a trade that goes against you and freeze. You also don’t want to see nice profit evaporate just because you didn’t have a plan.
Exit with a profit
You can set your goal to X time the ATR value, or when the price reaches the previous resistance.
This is all yours to decide also. Experiment with everything you can, you will start to see what best fits your need.
Exit with a loss
You need to always set a stop loss. As soon as you enter a trade, don’t even think about doing it tomorrow! You enter a trade, you enter a stop loss! This will save you a lot of money.
Now where you place it goes the same as the previous point. Find what you like.
It could be when the price crosses a moving average, or when a new low on the Donchian channels is created. Just some ideas…
I have published an article about stoploss in crypto with different examples and a free indicator that you can use on Tradingview.
You can check it out to get some ideas or even use it in your trading.
How much should you invest in each trade
Now, this is probably as important as the stop loss. It’s a very important part of your risk management.
The goals in trading should be: Protect your fund first, make money second.
You should always risk about 1-2% of your equity max. Doing this will protect you from a series of losses.
That doesn’t mean to bet 1-2% per trade. It means that if a trade goes wrong and hits your stop loss, you will only lose 1-2% of your trading equity.
You can still have nice sizes positions.
I have created an easy-to-use position size calculator. It is perfect for crypto and if you trade Futures with leverage.
Make sure to use it on every trade you take.
Type of orders
Before you start testing your strategy on a live exchange or on a paper trading account, you must be aware of the different types of orders.
In those descriptions, I use the word Buy to show an example. If you would like to Short (sell) reverse the logic of the description. (under/above, buy/sell)
Limit Orders
Limit orders will buy the coin or token at the price that you specify.
Your order will stay in the order book until the price reaches it.
Your buy Limit price must be under the current price or it will act as a market order.
Market Orders
The market order will buy the coin or token immediately.
It will buy from the closest Limit order in the order book.
If you are buying a big amount, a market order could buy at different prices, going through the order book as it fills your market order.
A market order usually has more fees than a limit order.
Stop Orders
Stop Orders are built from 2 prices. The Stop price and the Limit Price.
The stop price is used as a trigger to enter your Limit price in the book.
This is used to place a buy order above the current price. If you only use a limit order, it will buy instantly, making it a market order.
Buy using a Stop order, the exchange will wait for the stop price to be hit, then it will place the Limit price in the order book.
If your limit price is above the current price, it will act as a market order.
Paper Trading cryptocurrencies (Demo Trading)
To avoid losing too much money when you first start trading crypto, I highly suggest that you paper trade.
Paper trading lets you do the same trade as you would with real money. But it’s fictional money. So while you learn or if you want to test out some strategies, this is a great risk-free way to go!
Tradingview offers paper trading account to trade Bitcoin or any other crypto that is available in their charts.
When you are in a chart, you should see a tab called Trading Panel at the bottom of your screen. Click on it.

Then, click on Paper Trading and Connect.
You now have a 100K$ paper trading account.
To start trading, just select the chart of the crypto you want to trade.
Then in the bottom right corner of your screen, you will see 2 arrows in a button. This is the trading terminal.

From there, you can place orders, set your stop loss, take profit as well as decide how much you would like to buy/sell.
Trading Crypto on Binance (Live Trade)
After testing out your strategy for a little while and generating profit, you can start trading with real funds.
First, you will need to fund your Binance account. I explain how to do this in detail in this post. The post also explains how to send your funds to Binance if you need to.
If you only have a small balance to start with, you should check my post on how to get free crypto. I explain 7 ways to do this, some are pretty easy and can surely add at least 50$ to your portfolio.
Binance is not the easiest way to start trading as you need to enter each order (Entry, Take profit and Stop loss) separately.
I discuss better ways a little below.
But here’s an overview of how to do your first trade on Binance.
- Log into your Binance account
- In the top menu, hover the TRADE tab
- Select CLASSIC or ADVANCED. (Check both and use the one you are more confortable with)
- Enter your Entry order in the trading terminal
- Once your buy order is in the book or bought, immediadly enter your stop loss price using a STOP order
- If you have a define take profit, create a limit order for it.

Trade Crypto on a trading platform
As Binance is not that user-friendly to place orders, I would suggest that you use a trading platform.
A trading platform will let you place your whole trade at once. So as soon as you send your trade, the entry price, stop loss price, and take profit price are entered.
Trading platforms also offer nice tools like Trailing stop loss, Trailing take profit, Stop loss timeout, and more.
Here are some of the options you can have from different crypto trading platforms:
3Commas
3Commas has a very well-done trading terminal. It is intuitive and displays your orders on a chart.

They also offer trading bots (premium).
The free version of 3commas only lets you do 1 trade at a time, which could be a downside.
The subscription for unlimited trades starts at 29$ on a monthly basis up to 99$. If you buy on a yearly basis, the monthly price is reduced going from 11.60$ to 39.60$ which is worth it if you plan to use it for a while.
Zignaly
Zignaly offers a 100% free trading terminal. It is a bit less polished than the 3Commas one, but it will do the job.

Zignaly is primarily a trading signals marketplace. You will find tons of services using different strategies there.
Some are free, some charge a monthly fix fee and some are going for a revenue share basis.
Using Zignaly can be 100% free if you decide to and it won’t limit you in your options much. So it is well worth the try!
Connect Binance to Zignaly or 3Commas
In order to use the trading terminal on Zignaly and 3Commas, you will need to connect them to your Binance account.
By doing this, they will be able to place and manage your order directly on Binance.
The connection is made via secured API.
To get an Api from Binance, hover the user icon in the top right corner and select API MANAGEMENT.

On the API MANAGEMENT page, you will be able to create a new API.

Then simply add the API to the desired trading platform.
Once connected, you should see your funds appear on the trading platform. You are good to go!
Trading ressources
I hope that this guide will give you a good start with your crypto trading.
If you want to dig a little deeper, you should have a look at the different resources below.
Books
This book is the one you need to learn almost everything you need to know on technical analysis.
It is very detailed with charts. Talk about many indicators and their use. If you needed only one book to learn to trade, that is probably the one.

Trading in the zone will help you get in the right mindset to be a winning crypto trader.
The book doesn’t talk about strategies but instead helps you get psychologically ready to trade. It is also a must-read trading book!
This book ends up on many top lists over the internet, and it is very well deserved.
The New Market Wizards: Conversations with America’s Top Traders

The Market Wizards series offers 6 books. They are all great, but my favorite one is The New Market Wizards
In the series, Jack Schwager put his interview with top traders on paper.
Market wizards is perfect to get inspired, learn different strategies and learn from the mistakes of the best traders out there.
Youtube
C0TT0NC4NDYTA
This guy does in-depth Technical analysis teaching. He’s got hours and hours of videos that will certainly help you increase your T.A skills.
Rayner Teo
Rayner Teo explains every aspect of technical analysis through his small video.
Straight to the point and well explained, Rayner is a good reference for beginning crypto traders.
I am not a fan of many traders on youtube as they mostly try to hype shitcoin or are just sensationalist reporters. I think these 2 will do the job for you, but if you have any suggestions, don’t hesitate to comment below.
Websites
Investopedia
Complete resources for Technical Analysis. You will find definitions and examples of everything that exists in T.A. Perfect to discover new tools and learn how the ones you use actually work.
I will add more if I can find something that is as complete as Investopedia. But right now, this resource will give you everything you need.
Hope you enjoyed it!
That’s it for now, you should have a good idea of how to trade crypto right now.
Starting with the information of the guide will help you getting started. It won’t be easy, but with practice and discipline, anyone can do it.
Trading crypto is a lot of fun. Once you have a strategy setup and you follow it, you will find it way easier. You will feel in control.
No more FOMO, No more FUD. Execute your plan and be patient.
Please don’t hesitate to share with your friends and family that might be interested in joining you. It’s always good to have someone by your side to learn together.
If you have any questions or comments, please use the comment box below.
Thank you for reading!
