Table of Contents:
Overview
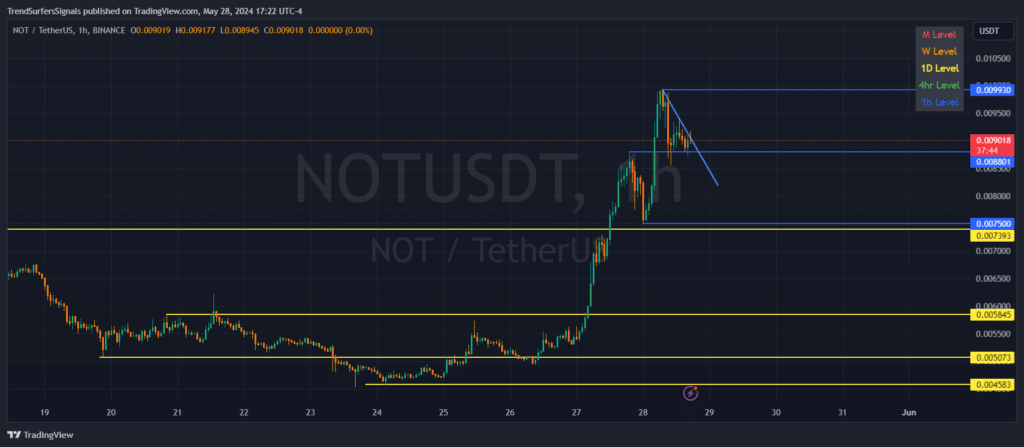
The 1-hour chart for Notcoin (NOT) against Tether (USDT) reveals significant recent price action and key levels to watch. The price has shown notable volatility and has reached important support and resistance levels.
Now, this chart is pretty young, but still having these levels can help us trade it better.
Recent Price Action
Notcoin has experienced a strong upward movement recently, breaking past several resistance levels. The price has since entered a period of consolidation, forming a descending channel.
Key Levels to Watch

Monthly Support and Resistance (Red)
- Resistance:
- 0.009018 USDT
Weekly Support and Resistance (Orange)
- Support:
- 0.007393 USDT
- 0.007500 USDT
Daily Support and Resistance (Yellow)
- Support:
- 0.005845 USDT
- 0.005073 USDT
- 0.004583 USDT
1-Hour Support and Resistance (Blue)
- Resistance:
- 0.009930 USDT
- Support:
- 0.008801 USDT
- 0.007500 USDT (previous resistance now acting as support)
1-Hour Chart Analysis
The 1-hour chart shows NOT currently trading around 0.009018 USDT.
The price recently tested the 0.009930 USDT resistance but was unable to break through, resulting in a pullback. The price is now consolidating around this level.
Market Commentary
Notcoin has shown significant bullish momentum, but the recent pullback indicates potential consolidation. Traders should closely watch the support around 0.008801 USDT.
Holding above this level could lead to a re-test of the 0.009930 USDT resistance and possibly higher levels.
Conversely, a break below this support could see NOT testing lower support levels, such as 0.007500 USDT and 0.007393 USDT.
Conclusion
Notcoin’s price action is at a crucial point, with a descending channel pattern indicating potential for a breakout. Monitoring the price action around the 0.009018 USDT level will be essential for traders.
A successful hold above this level could see NOT moving higher to test 0.009930 USDT and beyond. However, failure to hold this support could lead to a downside towards the next significant support levels.
Traders should remain vigilant, always use stoploss and watch for signs of a breakout in either direction.


