Table of Contents:
Overview
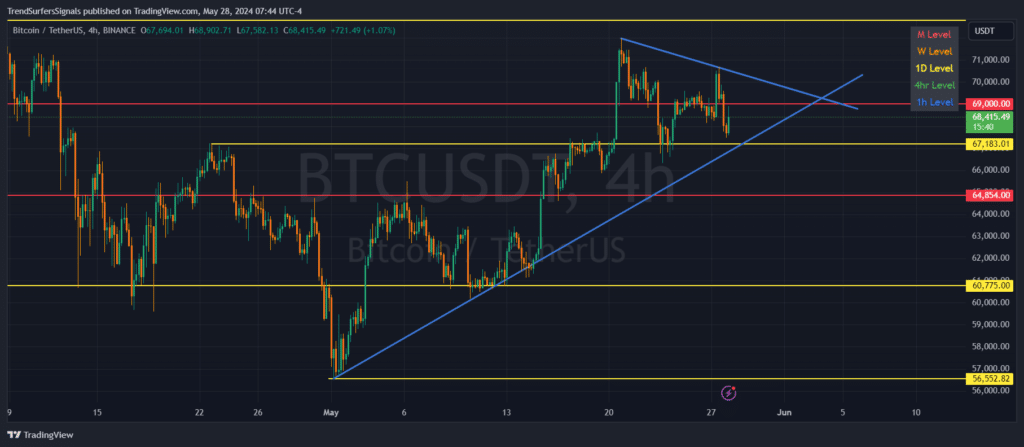
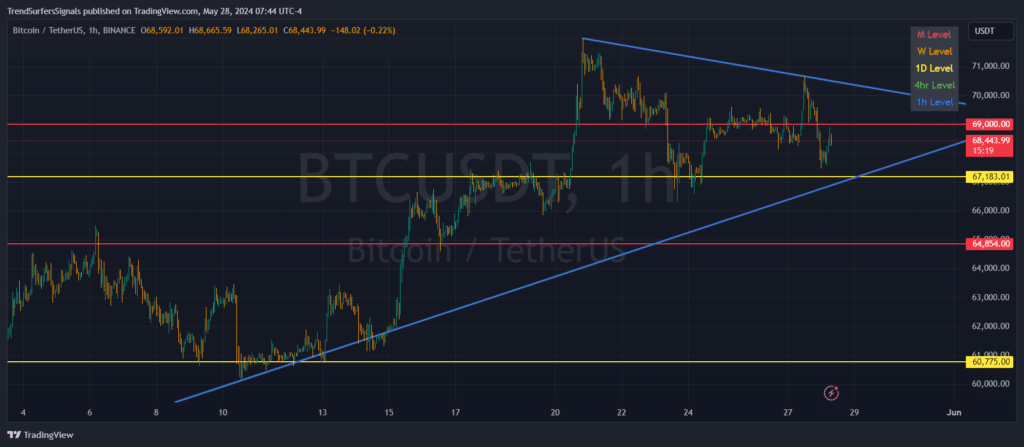
The charts for Bitcoin (BTC) against Tether (USDT) on both the 1-hour and 4-hour timeframes reveal significant price action and key levels to watch.
Let’s dive into the analysis of these charts to understand the current market situation and potential future movements.

Recent Price Action
Bitcoin has been experiencing fluctuations, testing both support and resistance levels.
The price has been moving within a defined range, forming a symmetrical triangle pattern, which typically indicates a period of consolidation before a breakout in either direction.
Key Levels to Watch
Monthly Support and Resistance (Red)
- Resistance:
- 69,000 USDT
Weekly Support and Resistance (Orange)
- Support:
- 64,854 USDT
Daily Support and Resistance (Yellow)
- Support:
- 67,183 USDT
- 60,775 USDT
1-Hour Chart Analysis
The 1-hour chart shows BTC currently trading around 68,443.99 USDT. The price recently tested the 69,000 USDT resistance but was unable to break through, resulting in a pullback.
The price is currently near the lower trendline of the symmetrical triangle, indicating potential support around this level.

4-Hour Chart Analysis
On the 4-hour chart, BTC has been trading within a symmetrical triangle pattern. This pattern suggests a period of consolidation, and a breakout is likely to happen soon.
The price is currently near the lower trendline of the triangle, which is critical for determining the next significant move.
Market Commentary
Bitcoin has shown resilience in maintaining its price above the key support levels. The symmetrical triangle pattern on the 4-hour chart indicates potential for a breakout. Traders should closely watch the support around the lower trendline of the triangle.
Holding above this level could lead to a re-test of the 69,000 USDT resistance and possibly higher levels. Conversely, a break below this trendline could see BTC testing lower support levels, such as 67,183 USDT and 64,854 USDT.
Conclusion
Bitcoin’s price action is at a critical juncture, with a symmetrical triangle pattern indicating potential for a breakout.
Monitoring the price action near the lower trendline of the triangle will be essential for traders. A successful hold above this level could see BTC moving higher to test 69,000 USDT and beyond.
However, failure to hold this support could lead to a downside towards the next significant support levels. Traders should remain vigilant, use proper stoploss and watch for signs of a breakout in either direction.


