Table of Contents:
Overview
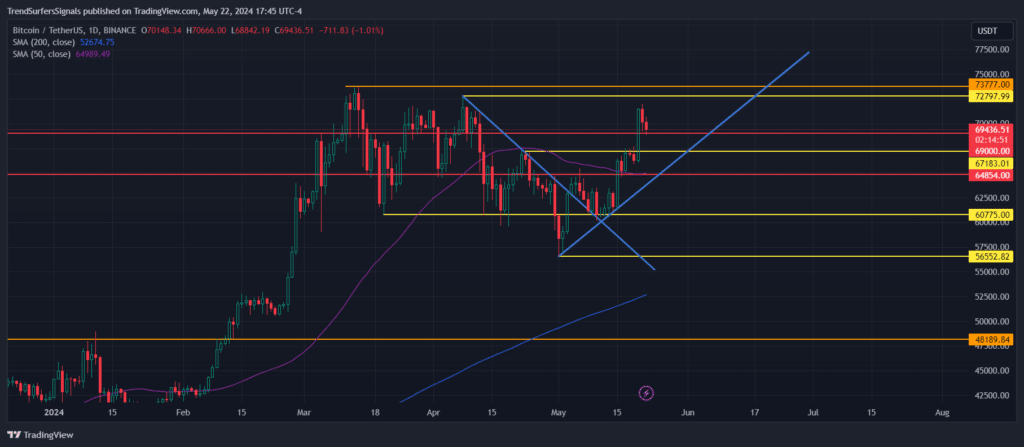
The chart shows the price movement of Bitcoin (BTC) against Tether (USDT) with various support and resistance levels highlighted in red, orange, and yellow, representing monthly, weekly, and daily levels respectively.

Key Levels
- Monthly Support (Red)
- 69000.00 USDT: Another significant monthly resistance level.
- 67183.01 USDT and 64854.00 USDT: Additional monthly support levels.
- Weekly Support (Orange)
- 73777.00 USDT and 72797.99 USDT: High weekly resistance levels.
- 60775.00 USDT: A crucial weekly support level.
- 48189.84 USDT: Another strong weekly support level.
- Daily Support (Yellow)
- 56552.82 USDT: A significant daily support level.
- Multiple other levels: Additional daily support points indicating minor support zones.
Moving Averages
- 200-day Simple Moving Average (SMA) at 52674.75 USDT: Indicates the overall long-term trend.
- 50-day Simple Moving Average (SMA) at 64989.49 USDT: Represents the medium-term trend.
Trend Lines
- Upward Sloping Trendline: Indicates recent bullish momentum.
- Downward Sloping Trendline: Shows a previous bearish trend which has been broken recently.
Current Price Action
- Current Price: Approximately 69436.51 USDT.
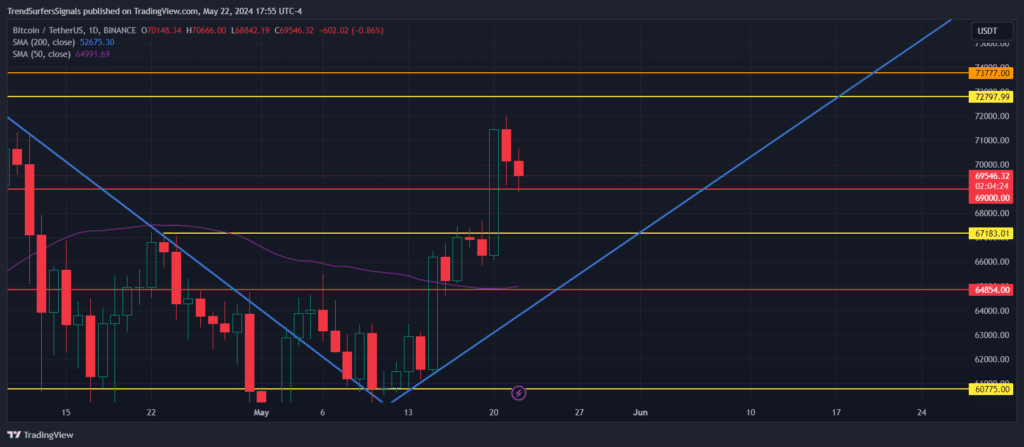
- Recent Movement: The price recently broke above the downward trendline, indicating a potential bullish reversal. The price is currently near the 69K resistance at 69436.51 USDT.

Potential Scenarios
Bullish Scenario:
- Breakout Above 72797.99 USDT:
- If the price breaks and holds above this level, it could indicate a continuation of the bullish trend.
- The next targets could be the weekly resistance levels at 72797.99 USDT and 73777.00 USDT All Time High.
- Support Retest:
- The price may retest the recent breakout level at 67183.01 USDT and/or the support at 69000.00 USDT before continuing upwards.
- Successful retest and bounce would confirm bullish strength.
Bearish Scenario:
- Failure to Break 72797.99 USDT:
- If the price fails to hold above this level, it could indicate a potential pullback.
- The price might drop to test the support levels at 69K first, then 67183.01 USDT and 64854.00 USDT. But we will have to revisit after 69K doesn’t hold.
- Break Below Support:
- If the price falls below the support levels, the next targets would be the daily support at 60775.00 USDT and potentially the 200-day SMA at 52674.75 USDT (Don’t panic, we are far from that).
Conclusion
For the upcoming week and month, monitoring the 69000.00 USDT level will be crucial. A successful breakout and hold above this level could indicate further bullish momentum with potential targets at the higher weekly resistance levels.
Conversely, failure to stay above this level could lead to a pullback towards the mentioned support levels. The overall trend remains bullish with the recent upward breakout, but caution is advised around key support and resistance levels.

